

 It’s time for another CTD cast!” I yell to the coxswain from where I sit in the warm cabin of the survey boat. Three computer screens displaying hydrographic data glare back at me. Racing the sunsets of ever-shortening days, we make the most of our eight-hour workdays, surveying continuously only to transit to the next survey area or take another water column profile to apply to the data later. Collecting hydrographic data is tiring; the days long, the seasons longer, and the amount of data to collect never-ending.
The two years I spent collecting hydrographic data around the coastline of Alaska for the National Oceanic and Atmospheric Administration (NOAA) as a NOAA Corps Officer were the most challenging yet rewarding of my professional life. As I learned where the roots of hydrography have come from, it amazes me the accuracy the early hydrographers had with even less technology. Yet, in a world of electronic advancement, the day inevitably approaches when we will see the last paper chart printed and the maritime industry relying on electronic charts.
Charting and hydrographic surveying have been practiced in the United States since the early 1800s when the Coast Survey conducted its first hydrographic survey and published the nation’s first chart in 1834. The roots of hydrographic surveying began when then President Thomas Jefferson and Congress authorized a “survey to be taken of the United States.” This initiative brought together mathematicians, cartographers, geodesists, meteorologists, hydrographers, and sailors to charts the waters around the United States. These first surveys were conducted with lead lines, i.e., rope or line with incremented measurements and lead weights attached to the end that were manually lowered and raised to measure the depth of the seafloor.
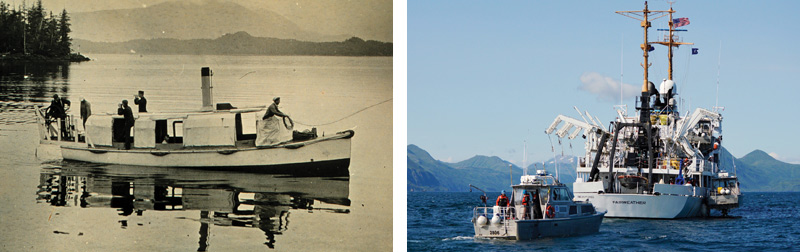
Above, left: Aluminum-hulled surveying vessel FA 2806 (left) waiting to get picked up by NOAA Ship Fairweather (right) after a day of surveying in Alaska. The surveying capabilities of the easily deployable smaller vessels are vital to NOAA chartmaking operations.
Imagine standing by the side of a boat to lower and raise a lead line in all types of weather while determining the position of that depth sounding with three sextant fixes referenced to points on a map. While the individual depth sounding may have been accurate, they were few and far between. By the nature of the surveying technique, rock pinnacles and other sharp contrasts within the seafloor were missed, giving the sailor of yore an inaccurate overall picture of what lay under their vessel.
By the early 1900s another surveying technique was introduced called the wire drag. These surveys were conducted with two vessels and a wire dragged between them, giving the hydrographers the depth and location of an obstruction. Although this method was a little more accurate and allowed the surveyors to cover more ground, it was easy to miss features and record inaccurate depths. Also, having a wire between two moving vessels created another danger, as it is not the most ideal setup for seagoing vessels to be attached to each other on the water.
By the 1930s, single beam sonars were put into practice and greatly improved surveying techniques. Single beam sonars use sound waves to help determine the depth of the sea floor directly below a vessel. Although this was an important breakthrough for hydrography, single beam sonars still left areas of un-surveyed ground. The survey vessel would run a series of track lines with set line spacing between them. This allowed the scientists to cover more seafloor and collect more data points in less time. However, the seafloor between the survey track lines could still have rock pinnacles and other obstructions that were missed due to the nature of this survey technique.
From the 1950s through the 1970s, several scientific advancements aided in improving survey quality and changed the way surveyors looked at the seafloor. Side scan sonars were introduced, which allowed the surveyor to get a more complete picture of the sea floor, greatly improving the identification and accuracy of underwater rocks, submerged wrecks, and other obstructions. Multibeam sonars were introduced as well. These systems allow the surveyor to obtain water depth information for 100 percent of the survey area.
Today, the majority of charts are created with data from multibeam sonars. Although this is the current practice for hydrographic surveys nowadays, it is just as important to check the source diagram of the paper charts sitting in your pilothouse to determine the accuracy of your own charts. This diagram will tell you what kind of survey and what years the survey was conducted to give you a better idea of how to navigate the waterway. One area of the chart may have been surveyed with multibeam, while another part may have used single beam. Especially in areas a sailor is unfamiliar with, using more caution with older types of sonar technology could go a long way. Moreover, it is imperative to realize that a storm may have come through since the last survey and changed the seafloor, creating new dangers to navigation that were not present during the initial survey.
But, wait — do people still even still use paper charts? In the world of advanced technology and improving consumer products, aren’t we on the path of letting go of these old school navigation ways? In fact, we are. The Office of Coast Survey, the National Oceanic and Atmospheric Administration’s (NOAA’s) office that conducts hydrographic surveys and produces the nation’s charts, are looking towards the future and anticipating where the future of charting lies.
The organization already outsourced their publishing of paper charts to the private sector, discontinuing printing their own charts in 2014. Today, NOAA is on track to transition solely to electronic charting. However, there is no timeline for when NOAA will stop producing paper and raster (RNC) chart products. This transition may take decades, and there are still many sailors who rely on the paper products. Additionally, the electronic navigational charts (ENCs) still need to improve before they are the primary source of navigation.
Raster Navigational Chart (RNC): A digitized paper chart that can be used electronically.
Electronic Navigational Chart (ENC): Created from a vector format, these charts are digitized data from a database.
ECDIS: Electronic Charting Display and Informational System.
IMO: International Maritime Organization.
ECS: Electronic Charting System
SOLAS: Safety of Life at Sea
Lead line survey: Partial bottom survey using a line with a lead weight attached to the end
Wire drag survey: Partial bottom survey using a weighted wire attached to two survey vessels
Single beam sonar: Partial bottom survey using a single beam of sound to measure the depth of the seafloor.
Multibeam sonar: Full-coverage survey using multiple beams of sound to measure the depth of the seafloor.
CTD: Conductivity, temperature, and depth profile of the water column. Data that is applied to hydrographic data to help determine the sound speed in various areas of the survey area.
The Office of Coast Survey began collecting electronic charting data in the 1980s and since then has been improving the ENC products used today in the electronic charting display and information system (ECDIS). ENCs became available to the public in the 1990s, and since then the number of mariners using the products has increased exponentially. This trend led to changes in U.S. Coast Guard regulations in regard to carrying paper charts versus using electronic charting displays. Since 2012, the shipping industry is making the transition to solely using the electronic charting system as its primary means of navigation, as the International Maritime Organization (IMO) adopted regulations for mandatory use of the system by July 2018 for certain SOLAS class vessels.
As this part of the shipping industry completes the change to electronic charts and ceases the use of paper charts, the Coast Guard has updated requirements for domestic voyage vessels as of February 2016, allowing those vessels subject to Coast Guard inspections to utilize electronic charts in the place of paper charts. This growing trend in the maritime industry is leading the demand for more electronic capabilities that will one day make the paper chart obsolete.
The electronic charting trend is changing the way charts are updated and new editions are released. Chart updates are categorized into critical and routine data. The critical data includes all changes that could pose a danger to navigation such as positions and characteristics of aids to navigation, wrecks, rocks, shoals, and changes in minimum depths of federally maintained channels. All other updates, not dangerous to navigation, such as shoreline surveys, are considered routine data. In the past, chart updates for ENC, RNC, and paper charts provided only the critical data and the new routine data was updated with new editions of charts.
Printing new editions of paper charts, until the practice was outsourced to the private sector, was driven by the amount of corrections, both critical and routine, compiled and the amount of charting paper available at the printing warehouse. Usually several thousands of copies were printed of a new edition chart, so if new corrections were few or there were plenty of charts in the warehouse, it was a low priority to create a new edition.
Although this system was economical for the government and allowed mariners to update their charts by hand, it was almost impossible to provide mariners with the most accurate hydrographic data in between chart editions. This lead to the print-on-demand charts that are printed from certified dealers. Mariners now do not need to wait for the next edition to come out, because charts can be printed weekly with up-to-date data.This includes all chart corrections since the edition was first released, including critical and routine survey data.
Improving chart content is another area that will help streamline the data displayed in electronic charts. The International Hydrographic Organization (IHO) requires that all depths on ENCs must be encoded in meters. However, all of NOAA’s 1,000+ plus paper charts, except for a handful, use feet and fathoms. When NOAA began compiling paper chart data for digitized data in the 1990s, the data was converted into meters and now the soundings and depth areas on US ENC charts are stored in decimal metric values; a one-fathom or six-foot contour was saved as 1.8 meters, a two-fathoms or 12-foot contour saved as 3.6 meters, and so on.
This kind of data input creates significant issues with selecting the most accurate safety contour on ENCs. For example, on approach charts, the contours are 10 meters and 20 meters. Since the stored data is saved at 9.1 meters (converted from five fathoms or 30 feet and 18.2 meters converted from 10 fathoms or 60 feet), if the mariner selected the 10-meter safety contour, it would not use the 9.1 meters stored in the database but would go to the next value of 18.2 meters, creating issues for deep draft vessels in shoal areas. The next step is adding more unit contours to ENCs to help those deep draft vessels and take one step closer to more metrification between international charts.
The metrification of ENC and raster charts has been attempted before. During the first international hydrographic conference in London in 1919, the conference “strongly recommended that all countries, as soon as convenient, adopt the metric system for their nautical publications.” Since that conference, the Office of Coast Survey attempted to convert all nautical charts from feet and fathoms to meters, but the task was too consuming, which is why only a handful of paper charts are in meters today. Coast Survey is revisiting this task and with the database of ENC values stored in meters, the transition should be less daunting than the first attempt. This standard will hopefully make US charts less confusing for US and international mariners sailing in and around US waters.
The era of ENC-only charts is already upon the maritime industry. In such that, NOAA raster charts were used as the source of the original suite of NOAA ENCs and every ENC has a corresponding raster chart. The Coast Survey began creating “ENC-only” charts that are not sourced from raster charts, but rather original source material. Some of these ENCs were sourced to create new raster charts, but for other large-scale products, raster charts were not created. This saved valuable time; time better spent carrying out other areas of the Coast Survey mission than maintaining raster charts.
The 2018 deadline for larger SOLAS ships to just carry ENCs is a driver to determining the initial stages of “ENC-only” charts. In monitoring the sales and downloads of ENCs and RNCs, the numbers will aid in deciding which charts can make the leap to electronic capabilities only.
The future of charting continues to demand more information with less time to deliver the final product. The Office of Coast Survey has come a long way from dropping lead lines over the side of survey boats, yet the leap from paper charts to solely electronic data may be closer than we think. As data become more readily available to a larger audience, the next logical step is streamlining databases to more user-friendly interfaces. The maritime industry is taking a giant leap. Once that leap is taken, there is no looking back to the hard-earned, coffee-stained paper chart sitting in the pilothouse.