
The Earth Wind Map web site way cool and a great way for people to see what is going on with the current weather. On this chart for instance if you were watching the GoDaddy Bowl in Mobile, Alabama a couple nights ago you noticed there was a lot of wind there. With the Earth Wind Map, just hold your pointer on the globe and move it so Mobile is in the center of the screen and you’ll see why. Have you heard about the cold weather in the Eastern US by any chance and the subsequent Nor’Easter along the New England Seaboard?
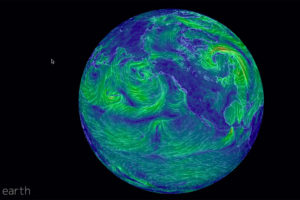 Pretty easy to see that as well. Remember, the closer the lines are together, the higher the windspeed. Then there’s Great Britain being pounded by high winds and record rainfall just move on over and take a peek to see why. You do need to remember that this is roughly a surface pressure chart, 1000mb to be exact, which is the same as 1000hPa shown in the URL which is the geopotential height. When you get the upper atmosphere charts from the NWS the highest they show is 500mb which is one of the charts we use to try and predict how pressure systems will move and as a result how much wind we’ll have where when we’re racing to Hawaii. So if you want to have some fun just change out the 1000hPa in the URL to 500hPa and you’ll get a much more dramatic chart.
So how does this relate to the actual upper atmosphere altitude? Remember that the National Weather Service defines geopotential height as roughly the height above sea level of a pressure level. For example, if a station reports that the 500 mb height at its location is 5600 m, it means that the level of the atmosphere over that station at which the atmospheric pressure is 500 mb is 5600 meters (18,374-feet) above sea level. This is an estimated height based on temperature and pressure data. So for a 1000mb the pressure is going to be higher and closer to the surface of the earth. As I mentioned above this could be very useful when you’re racing to Hawaii as the high pressure ridge will be very dramatically depicted making it easier for navigators to choose where they want to cross.